This is my summary and review of the paper Monarch: Google’s Planet-Scale In-Memory Time Series Database
Introduction
Monarch is Google’s modern time-series database.
Due to their scale, their monitoring infrastructure is gathering billions of
metrics across all of their services.
Previously to Monarch, they had been using Borgmon, which is their internal ancestor of Prometheus.
Monarch has been built out of a need to outgrow Borgmon, as it had a number of issues.
- Due to its decentralized model, teams had to operate Borgmon themselves, which induced operational overhead that they didn’t necessarily have the expertise to do.
- It made correlating data between components on different Borgmon instances harder, as the data is effectively decentralized.
- The lack of a schema for measurement dimensions and metrics results in semantic ambiguities of queries, which limits the expressiveness of the query language.
- Borgmon doesn’t have good support for histograms.
System Overview
As any monitoring and alerting system, Monarch is in a very critical path. So when designing it, they have decided to trade consistency for high availability and partition tolerance.
Monarch will drop delayed writes, and prefer returning partial data than fully
accurate one.
They will, however, indicate that the provided data may be incomplete or inconsistent.
The system has been built to be as low dependency as possible. They will
therefore store all monitoring data in memory instead of dedicated storage.
This is because all of Google’s storage systems rely on Monarch for their
monitoring. They therefore cannot have circular dependency on the alerting path.
Note that Monarch does include a recovery logs mechanism which allow storing data for archival. However, that system is best-effort, and not involved in the query path at all.
Monarch is subdivided in autonomous regional zones combined with global management and querying. But the data remains within a region, and queries go straight to asking for the data within the appropriate areas.
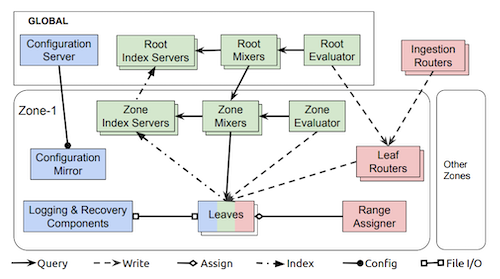
There are three different kinds of components within Monarch:
- Those responsible for holding state (in blue), such as the leaves which store data in memory.
- Data ingestion components (in red), which accept new metrics from other components.
- Query execution components (in green), which accept queries and retrieve their data.
Data Model
The Monarch data model has two schemas, targets and metrics.
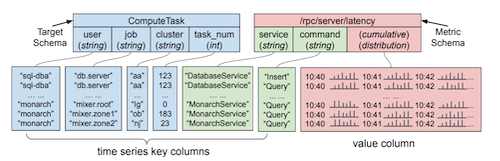
Targets allow associating each time series with a source entity. For example, a running process or a VM.
There are multiple target schemas for the different types of entity being
monitored.
For example, ComputeTask is a common target schema.
Monarch stores the data close to where it has been generated. So each target
schema contains one field annotated as location. In the case of ComputeTask,
it’s cluster, which specifies the name of the Monarch zone where the data will be located.
Metrics associate time-serie values with a target, such as the number of RPC tasks being served.
Scalable Collection
When writing data into Monarch, the following steps are followed:
- The client sends the data to a nearby ingestion router, within the same cluster. An instrumentation library is provided, which is responsible for finding that router, and sending the data with the appropriate frequency.
- The ingestion router finds the appropriate destination zone based on the value of the target’s
locationfield, and forwards the data to the appropriate leaf router. - The leaf router forwards the data to the appropriate leaves within the zone
- Each leaf write the data into its in-memory store, as well as recovery logs.
Leaves do not wait for acknowledgement when writing to the recovery range. So, if the recovery log is unavailable, the system will continue working, minus long-term storage.
As there can be multiple leaves within a zone, they need to share their load accordingly, which means possibly having to move data across leaves.
Each zone has a range assigner, which balances load across leaves. If it decides to move a range of data R, the following happens:
- The range assigners tells the leaf that it now needs to start collecting data for
R. That leaf informs the routers it needs to start collecting that data. - The routers start sending new data to that leaf, as well as the old one.
- After waiting for a second so the data in the previous leaf has reached the recovery log, the new leaf starts recovering it, with the newest data first, as it’s more critical.
- Once all the data has been recovered, the new leaf notifies the range assigner, so
Rcan be unassigned from the old leaf. It stops collecting data, and drops it from its in-memory store.
Storing all the data naively as it is provided by the clients could be very
expensive. For example, if each server sends their disk I/O, a lot of data will
be gathered. But each disk’s value will never be useful. Rather, aggregated
data by user will be much more useful.
Monarch therefore allows aggregating data during ingestion.
Scalable Queries
Monarch provides a querying language quite similar to SQL to retrieve metrics data.
{ fetch ComputeTask::/rpc/server/latency
  | filter user=="monarch"
  | align delta(1h)
; fetch ComputeTask::/build/label
  | filter user=="monarch" && job=~"mixer.*"
} | join
  | group_by [label], aggregate(latency)
There are two kinds of queries that exist in Monarch.
- Ad Hoc queries are the ones made by users.
- Standing queries are periodic materialized-view queries which are stored back into monarch.
Standing queries can be used to condense data for faster subsequent querying, or for alerting.
All queries are received by the root mixer (see figure 1), which sends it to the appropriate zone mixers, each of which sends it to the appropriate leaves.
The root mixer does level analysis, to send only the parts of the query that
need to be executed by the lower level. The root also performs security and
access-control checks, as well as possible rewriting of the query for static
optimization.
Within the leaf, each query runs in its own thread, which are monitored and can
be killed if they use too many resources.
Static analysis of the query allows pushing the query to be executed as close
to the data source as possible.
For example, if the query is detected to retrieve only data from a single zone,
the query will be pushed to that level.
When sending a query to children, Monarch uses Field Hints Index to skip
irrelevant ones.
A Field Hint is an excerpt of a field value, used to detect whether a zone
contains data about that value.
Each zone index server build an index of trigrams from their field values at boot
time (which takes a few minutes), and stores it in memory.
A long-lived RPC connection is then kept with the parent index server so the
field hints index can be sent upstream.
When considering sending a query downstream, an index server can therefore
start by looking into that field hints index to check whether the zone index is
likely to have that data or not.
Similarly to data ingestion, it is very important for queries to be fast, and to handle failures gracefully.
Therefore, if a zone becomes unresponsive, or too slow, it is pruned from the
global system, and query responses are notified.
This allows returning queries rapidly, amid possibly missing some data.
Similarly, if a primary leaf receives queries to be processed. However, if it becomes unresponsive or slow, the query is replicated to fallback leaves, and the response is de-duplicated from the fastest of both queries.
Configuration Management
All configurations are stored in the global area, and duplicated within zones to be reliably available.
Several types of configurations are available to users:
- Schemas - While there are common target and metrics schemas used for most of the data, advanced users can define their own, and set access control.
- Collection, aggregation and retention - Users can configure how frequently their data will be sampled, how long it will be retained and the storage medium.
- Standing queries - Users can configure standing queries which are executed regularly and for which the results are stored within Monarch, for alerting for example.
Evaluation
Monarch has 3 internal environments: Internal, external and meta.
Internal and external are for customers, either inside or outside of Google.
Meta runs on a stable, older version of Monarch, and monitors the other environments.
The evaluation in the paper relies on data from the internal environment.
As of July 2019, Monarch stored nearly 950 billion time series, using around 750 TB of memory. During that same month, the internal environment ingested 2.2 TB of data.
In July 2019, around 6M query were executed each second.
95% of the executed queries are standing ones.
Lessons Learned
Monarch allowed Google to learn a few key lessons:
- Lexicographic sharding of time series keys improves ingestion and query scalability, enabling zones to scale to tens of thousands of leaves.
- Push-based data collection improves robustness while simplifying system architecture.
- A schematized data model improves robustness and enhances performance.
- System scaling is a continuous process.
- Running monarch as a multi-tenant service is convenient for users, but challenging for developers.
Conclusion
The main takeaway I am getting from this paper is how pull-based proved not to work at Google, which I find quite interesting in comparison with the success of Prometheus and pull-based metrics.
The highly distributed design of Monarch is also extremely valuable, especially in keeping all the data in memory, and storing it for long-term recovery as something secondary. That definitely makes a lot of sense for a monitoring system, where the data is interesting for a very short period of time.