Ever since we need to operate hardware and software in production, we have needed to know how those behave. For example, when I brew craft beer, I use an iSpindle to monitor the temperature and the gravity of my wort.
Every 15 minutes, the tool wakes up, checks the value it has to check, and sends them to a provider which stores that data and shows me graphs.
This works very well, and allows good monitoring of production impact. If my fridge stops working and my wort start going into too high temperatures, I can be alerted and fix the problem.
But does this also work well for modern web platforms?
The limits of metrics
The main difference between my small home brew setup and a web platform is the scale. While I’m sending metrics once every 15 minutes, your platform will have thousands of requests every second (or at least, that’s the hope).
A web platform will also need to track way more data than I need with my fermentations. There will be user agents, IP addresses, user IDs, and much more that you need to know about within your observability data to be able to properly investigate issues.
Cardinality
The cardinality of a metric is a number of individual values it has. If you
have a metric for HTTP requests which has the HTTP method as an attribute, and
the possible values are GET and POST, your cardinality is 2. If you add
the status code as an attribute, and you can have 200 and 500 as status
codes, then your cardinality is 4.
Now, if you want to know the latency of HTTP requests for a specific customer,
you need to add their ID as an attribute, which will up your cardinality to
your number of customers, multiplied by the cardinality of all the other
attributes. Indeed, each metric with different attributes is considered as a
different metric.
Unless you want to overwhelm your Time Series Database, you do not want high
cardinality in your metrics. Tracking the HTTP method is fine. Tracking the
major number of the status code (for example, 2xx) is fine too. But don’t put
a user ID in there, or your bill will explode quite quickly.
As a general rule, all your metric attributes should have bounds, so you can predict your cardinality, and the scale of your TSDB. Setting any unbounded attributes (such as user ID) will give you issues at scale.
Aggregates
If low cardinality were the only issue with metrics, that wouldn’t be so
problematic. We could “just” scale up our databases to handle more data, or
write new engines that allow higher cardinality.
But to emit metrics, your service is also aggregating data, losing context
which can be very important when investigating an issue.
Metrics work well to measure counters or gauges, which are values that go up or down but represent a single event. For example, CPU usage. However, they have a major issue when measuring histograms, such as latency, or request size.
In OpenMetrics format, metrics measuring the latency of an HTTP service would be emitted like this:
http_request_duration_seconds_sum{service="api"} 8953.332
http_request_duration_seconds_count{service="api"} 38526
http_request_duration_seconds_bucket{service="api", le="0"}
http_request_duration_seconds_bucket{service="api", le="0.01"} 0
http_request_duration_seconds_bucket{service="api", le="0.025"} 8
http_request_duration_seconds_bucket{service="api", le="0.05"} 1672
http_request_duration_seconds_bucket{service="api", le="0.1"} 8954
http_request_duration_seconds_bucket{service="api", le="+Inf"} 27892
This histogram has several metrics:
- The
_summetric is the sum of all measurements. - The
_countmetric is the total number of HTTP requests being made.
The rest of the metrics, in _bucket are the number of HTTP requests being
made and for which the response time is lower or equal to the value tagged, and
higher than the smaller bucket value.
For example, we know we have 8 requests for which the duration was between 0.01
and 0.025ms. We also know that 27892 requests had a response time higher than
0.1ms.
However, we have no way of knowing whether the requests in the first bucket
were at 0.02ms, or at 0.024ms. Or if the ones in the second were at 0.2ms, or
30s.
Of course, every metrics client will allow you to set up the buckets of your choice, allowing you to set much higher values than 0.1. But if an unexpected event happens and your metrics aren’t (yet) properly configured to track it, you will have no way of properly investigating it.
Unknown Unknowns
To properly operate a service in production, you need to be able to know what
is happening within it, starting at the macro level, and being able to dig deep
into specific requests.
As we have seen, metrics only allow you to look at the macro level. They don’t
allow you to dig into specific problematic requests.
If you know what the problem is, and just need to know when it happens, they
are very good.
However, within all our modern web services, problems happen that we just don’t
know about. And we especially need to know about those.
If you get alerted for high HTTP latency on a service, it could be a global issue, impacting all the service’s requests. But it could also be a specific issue impacting only a specific endpoint, or a specific subset of customers. If you can’t answer that question, all you’re doing during incidents is guessing, using tribal knowledge (and promoting hero culture).
We can do better
OK, so what do we want?
We want a system where we can send (very) high cardinality data.
We want a system where we can gather macro-level graphs, and then dig into specific requests.
You may already have thought of (semantic) logs, and you would be right!
Let’s say with each HTTP request, I’m sending the following JSON log line:
{
	"method": "POST",
	"path": "/users",
	"user_id": "b38239dd-aebc-4a41-8ed9-55f7ff7d77bb",
	"request_id": "a61a989a-2fc6-483a-965d-cc706d80061b",
	"user_agent": "Mozilla/5.0 [...]",
	"started_at": 1662105599349,
	"finished_at": 1662105599352,
	"status_code": 200
}
Then, when the log is ingested, the database can also aggregate some pre-set
metrics that will be used for alerting.
The day you need to investigate an issue on the service, you can start with the
computed metric and easily switch to micro-level investigations directly on the
requests themselves.
The next iteration
Logs are an awesome first step towards observability. But they lack context.
Our log line above has a request_id field that we can reuse in other log
entries to get everything that happened within a specific request. But that
view is going to be hard to read as it is linear.
If your platform has several services, it is also going to be hard to link two
(or more) requests together.
Now, what we need is convention for our logs. We want several things:
- A way to propagate our request IDs across services.
- A conventional way to pass start/end times, so our visualization service can better display our log entries.
By now, you may see where I’m going. So let’s give it: if you don’t need metrics, you also don’t need logs. What you want is traces.
Take the following Go example using OpenTelemetry:
func httpHandler(w http.ResponseWriter, r *http.Request) {
	ctx, span := tracer.Start(r.Context(), "hello-span")
	defer span.End()
	w.Write([]byte("Hello World"))
}
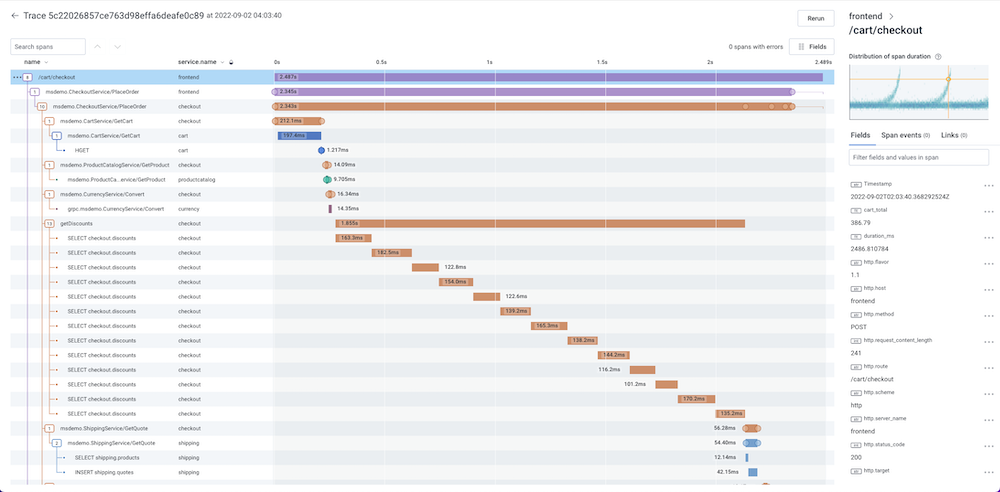
This bit of code will emit a span (which again, can be seen as a log with lots of conventions) tied to the function. Once sent to your provider, it can be displayed as a gantt chart, to view exactly what happened during a request.
Cardinality
Your tracing provider will likely use a column-based datastore, where data will be stored in columns.
Storing the traces in columns allows quickly retrieving data, even if they have
very different attributes, and no matter how many they have.
So you can have spans with hundreds of attributes, and contrarily to metrics,
it won’t make your database vastly bigger nor slower.
For more details on how column-based datastores for traces work, I recommend this talk:
Aggregates
With traces, you are now sending raw data (though possibly sampled). So it is
not aggregated anymore.
You can easily track the exact latency outliers, since you’re retaining the
exact attributes stored from them.
Of course, data may be aggregated within your provider, to build graphs that
provide a longer data retention than your raw span data is kept.
But those graphs don’t impact your service’s code, and your recent raw data is
always available to be queried and to investigate.
And they lived happily ever after
With this way of storing your observability data, you can be paged for an
increased HTTP latency issue, see that only a specific endpoint is impacted by
that latency. And even that only a few customers are facing the issue. You can
even know if a specific SQL query is causing contention and the latency.
With that information, you can properly mitigate the issue, and better
communicate it with your customers.
When metrics only offer you an approximation of what’s happening in production, traces will allow you to scientifically validate the root cause of an issue.
While metrics require intrinsic knowledge of a service to be able to properly
understand issues, by ditching them and relying on traces instead,
you can shift your entire on-call culture.
People can query their traces for any question they might have. And the person
who can best debug an issue won’t be the most senior in the team anymore, but
the most curious one.
Need more convincing?
By this point, you may be thinking I’m just being pedantic and unrealistic, in which case I would just say that it’s not because something worked great for years that we shouldn’t reconsider it from scratch if something better is coming up.
If you want to try it out by yourself, take a look at the OpenTelemetry demo.
Metrics are still sometimes useful
Most of the metrics we use today should disappear. For example, there’s no need
for a metric with HTTP error rates anymore. You can infer that from traces.
However, there will still be times when metrics are useful. My iSpindle
example from the beginning of this article is a good case.
Even a web service can benefit from some metrics, even though you may realize
they should be quite rare. Anything that cannot be encompassed in an event
(an HTTP request is an event) but still needs to be tracked is a good candidate
for a metric.
For example, tracking available disk space for a database is a good metric. And
it will allow you to be aware of upcoming issues much earlier than waiting for
errors being raised due to missing disk space.
Conclusion
When the Google SRE book was released in 2016, it started a small revolution,
and suddenly, everybody wanted to create SLOs. But nobody really had the
tooling to do them.
We were sold on creating error budgets, but couldn’t do them with metrics, as
they weren’t granular enough.
Now, the market has slowly started to shift to allow us to really apply the
principles outlined in SRE, and further, get meaningful
availability.
Traces are a great way to achieve that increased observability on our platforms, and finally be able to really know what’s happening on them, and not just guess.