OpenTelemetry is making observability much easier, especially by providing the
first widely accepted vendor agnostic telemetry libraries.
The first signal the project implemented is tracing, which is now GA in most
languages.
I am particularly fond of tracing, as I deeply believe it is a better way to pass data to a provider, whom can then process it and turn it into something actionable, whether it be a gantt chart of spans, or metrics for alerting.
But one of the most useful uses is distributed tracing, the ability to link spans across services into the same trace. If a service makes an RPC call to another, we can keep the trace context within them and get a global view of every request being made to a platform.
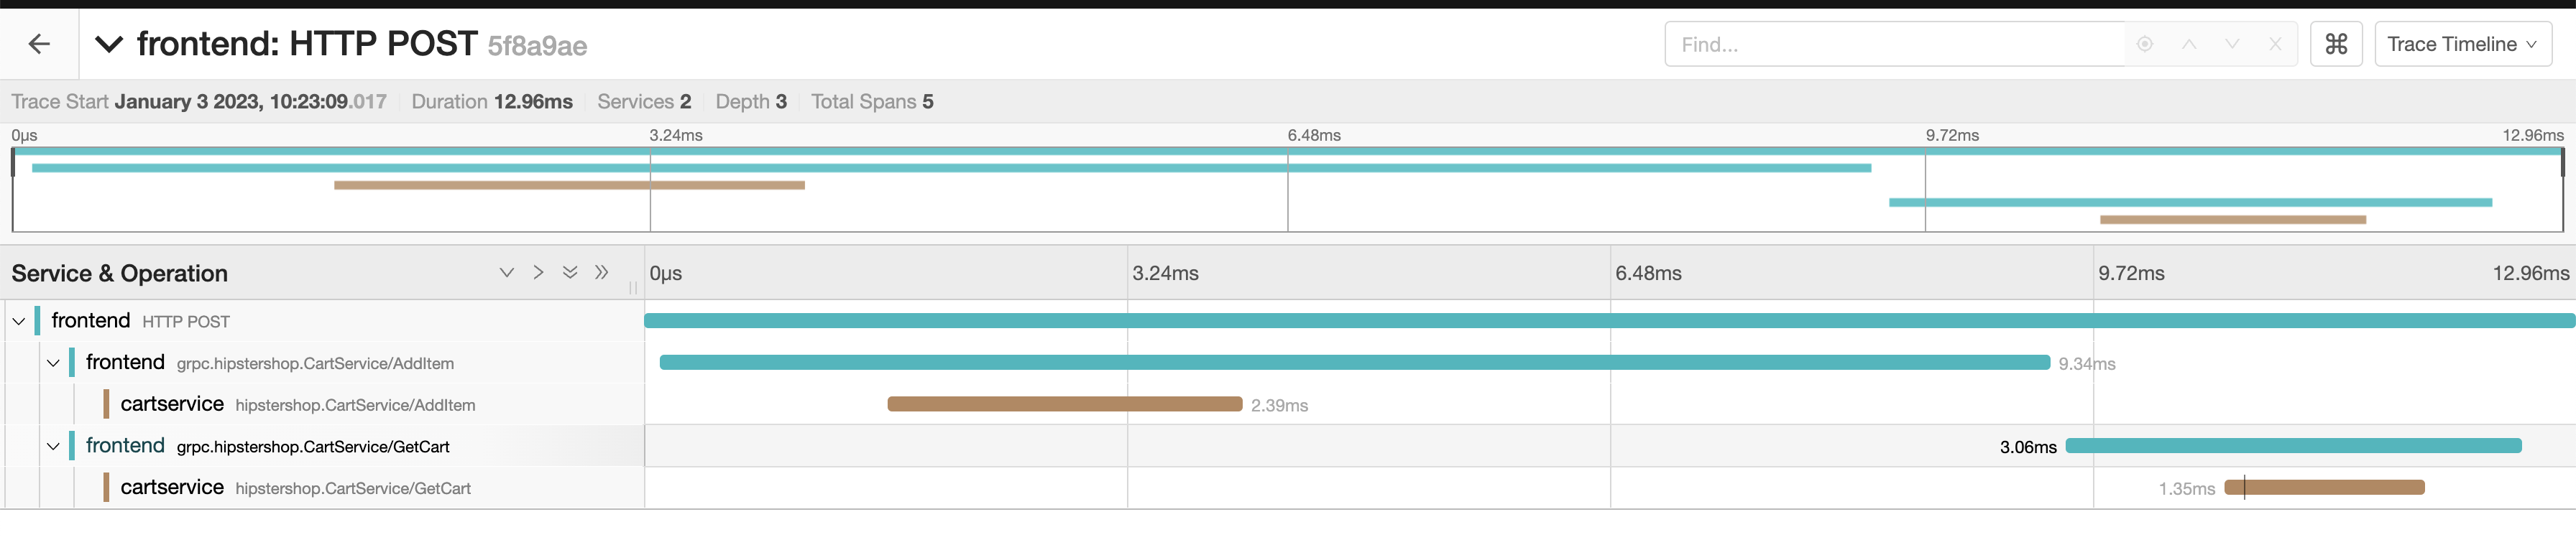
In the screenshot above for example, the trace has spans from 2 different
services, frontend and cartservice.
What is trace propagation?
In order to be able to link traces between those services, some context has to be passed around. This is what trace propagation is about and that we are going to explain in this article.
W3C Trace Context
Unless you are dealing with a legacy architecture which already propagates
traces using another convention, you should rely on the W3C Trace Context
Recommendation.
This recommendation is specifically for HTTP requests. But some of it can
largely be reused for other communication methods (across kafka messages for
example).
Trace Context specifies two HTTP headers that will be used to pass context
around, traceparent and tracestate.
traceparent
The traceparent HTTP header includes the root of context propagation. It consists in a comma-separated suite of fields that include:
- The version of Trace Context being used. Only one version,
00exists in 2023.
Then, for version 00:
- The current Trace ID, as a 16-byte array representing the ID of the entire trace.
- The current Span ID (called
parent-idin the spec), an 8-byte array representing the ID of the parent request. - Flags, an 8-byte hex-encoded field which controls tracing flags such as sampling.
tracestate
The tracestate HTTP header is meant to include proprietary data used to pass specific information across traces.
Its value is a comma-separated list of key/values, where each pair is separated
by an equal sign.
Obviously, the trace state shouldn’t include any sensitive data.
For example, with requests coming from public API endpoints which can be called either by internal services, or by external customers, both could be passing a traceparent header. However, external ones would generate orphan spans, as the parent one is stored within the customer’s service, not ours.
So we add a tracestate value indicating the request comes from an internal service, and we only propagate context if that value is present.
A context is passed
With both these fields being passed, any tracing library should have enough information to provide distributed tracing.
A request could pass the following headers:
traceparent: 00-d4cda95b652f4a1592b449d5929fda1b-6e0c63257de34c92-01
tracestate: mycompany=true
The traceparent header indicates a trace ID
(d4cda95b652f4a1592b449d5929fda1b), a span ID (6e0c63257de34c92), and sets
a flag indicating the parent span was sampled (so it’s likely we want to sample
this one too).
The tracestate header provides a specific key/value that we can use to make appropriate decisions, such as whether we want to keep the context or not.
How OpenTelemetry implements propagation
The OpenTelemetry specification specifies a propagators interface to allow any implementation to setup their own propagation convention, such as TraceContext.
A propagator must implement two methods, one for injecting the current span context into an object (such an HTTP headers hash), and one for extracting data from an object back into a span context.
For example, the following is the Go implementation:
// TextMapPropagator propagates cross-cutting concerns as key-value text
// pairs within a carrier that travels in-band across process boundaries.
type TextMapPropagator interface {
	// Inject set cross-cutting concerns from the Context into the carrier.
	Inject(ctx context.Context, carrier TextMapCarrier)
		// Extract reads cross-cutting concerns from the carrier into a Context.
		Extract(ctx context.Context, carrier TextMapCarrier) context.Context
		// Fields returns the keys whose values are set with Inject.
		Fields() []string
}
Each instrumentation library making or receiving external calls then has the responsibility to call inject/extract to write/read the span context and have it passed around.
Extract and Inject examples
For example, the following is Rack extracting the context from the propagator to generate a new span in Ruby:
extracted_context = OpenTelemetry.propagation.extract(
	env,
	getter: OpenTelemetry::Common::Propagation.rack_env_getter
	)
frontend_context = create_frontend_span(env, extracted_context)
And the following is NodeJS adding the context into HTTP
headers
when making a request with the http package:
propagation.inject(requestContext, optionsParsed.headers);
The full propagation flow

To put in other words, the diagram above shows what each service is expected to
perform to enable propagation.
The library emitting an HTTP call is expected to call inject, which will add
the proper HTTP headers to the request.
The library receiving HTTP requests is expected to call extract to retrieve
the proper span context from the request’s HTTP headers.
Note that each language implementation of OpenTelemetry provides multiple
contrib packages that allow easy instrumentation of common frameworks and
libraries. Those packages will handle propagation for you.
Unless you write your own framework or HTTP library, you should not need to
call inject or extract yourself.
All you need to do is configure the global propagation mechanism (see below).
Non-HTTP propagation
Not all services communicate through HTTP.
For example, you could have one service emitting a Kafka message, and another
one reading it.
The OpenTelemetry propagation API is purposefully generic, as all it does is
read a hash and return a span context, or read a span context and inject data
into a hash.
So you could replace a hash of HTTP headers with anything you want.
The Python Kafka instrumentation calls inject on the message’s headers when producing a message:
propagate.inject(
		headers,
		context=trace.set_span_in_context(span),
		setter=_kafka_setter,
)
And calls extract on those same headers when reading a message:
extracted_context = propagate.extract(
		record.headers, getter=_kafka_getter
)
Any language or library that uses the same convention can benefit from distributed tracing within kafka messages, or any other communication mechanism.
Setting a propagator
Great! We now know how propagation for traces works within OpenTelemetry. But how do we set it up?
Each OpenTelemetry library is expected to provide methods for setting and retrieving a global propagator.
For example, the Rust implementation provides global::set_text_map_propagator and global::get_text_map_propagator that will allow configuring and retrieving the global propagator.
As you may have seen in the above specification link, the default propagator will be a no-op:
The OpenTelemetry API MUST use no-op propagators unless explicitly configured otherwise.
You should therefore always ensure your propagator of choice is properly set globally, and each library that needs to call inject or extract will then be able to retrieve it.
Each OpenTelemetry implementation will implement several propagators natively, including TraceContext, which you can use directly within your service. For example, the java one can be found as io.opentelemetry.api.trace.propagation.W3CTraceContextPropagator
Going further
Thank you for following along this exploration of context propagation in
OpenTelemetry, which I hope now allows you to better understand how distributed
tracing works within that library.
You should now be able to setup your own context propagation within any library
instrumentation which communicates with external services, or receives
communications from them.
And with distributed tracing fully setup within a platform’s tracing, you should be able to visualize the entire flow of every request coming into your platform, and more easily troubleshoot problems and issues.